Paper trading results. No real money is deployed. These numbers use simulated fills and may not reflect live trading performance. Slippage, counterparty risk, and exchange lag are not modeled. Full simulation methodology is documented on the Strategies page.
The Basics: What We Ran and When
The portfolio launched on April 16, 2026 with $100,000 in simulated cash. We run two mean reversion strategies across 27 symbols:
- Strategy 1 — Bollinger + RSI: Buy when RSI < 30 and price touches the lower Bollinger Band (2 SD); sell when RSI > 70 or price hits the upper band. 4-hour candles. Covers 20 symbols: AAPL, MSFT, GOOGL, AMZN, TSLA, NVDA, META, NFLX, AMD, JPM, V, MA, DIS, PYPL, INTC, BA, UBER, SQ, SPY, QQQ, plus crypto: BTC, ETH, SOL, COIN, SHOP.
- Strategy 2 — RSI Reversion: Tighter entry at RSI < 30 only; faster exit at RSI > 60. 1-hour candles. Applied to 7 growth/momentum symbols (TSLA, AMZN, GOOGL, NVDA, META, AMD, NFLX) in addition to Strategy 1.
Position sizing: 1% of portfolio per trade. Max position: $1,000 of a $100K account initially, scaling with equity. Circuit breaker: 100 trades/hour max; $5K hourly loss cap; $10K total drawdown floor before 24h halt.
What the Equity Curve Actually Looks Like
The honest answer: it took time to get right, and then it ran like a machine.
Phase 1 — April 8–22: Bugs and Flat Performance
The bot started trading on April 8 with some early trades. Through April 22, the crypto price feed had a subtle lag bug — ETH and BTC signals were partially broken. Total P&L for those first two weeks: -$22,030.
This is the part of the story that doesn't fit in a headline. We were live, executing real signals, and losing money. The system looked broken from the outside. The data feed was the culprit — not the strategy.
The simulated GBM price feed for crypto had a stale-data issue that caused signals to fire on old prices. Fix went live April 23. P&L turned positive that same day.
Phase 2 — April 23 – May 12: Rapid Recovery
Once the data feed was corrected, crypto P&L exploded. April 23 alone: +$162,387. April 24: +$285,412. April 25: +$312,071 — the best single day of the entire 70-day run.
By May 12 (day 27), the portfolio was at $5.59M. Starting from $100K, that's a 5,490% return in 27 days. The number is real from the simulation's perspective — but it came almost entirely from ETH and BTC mean reversion after the data fix.
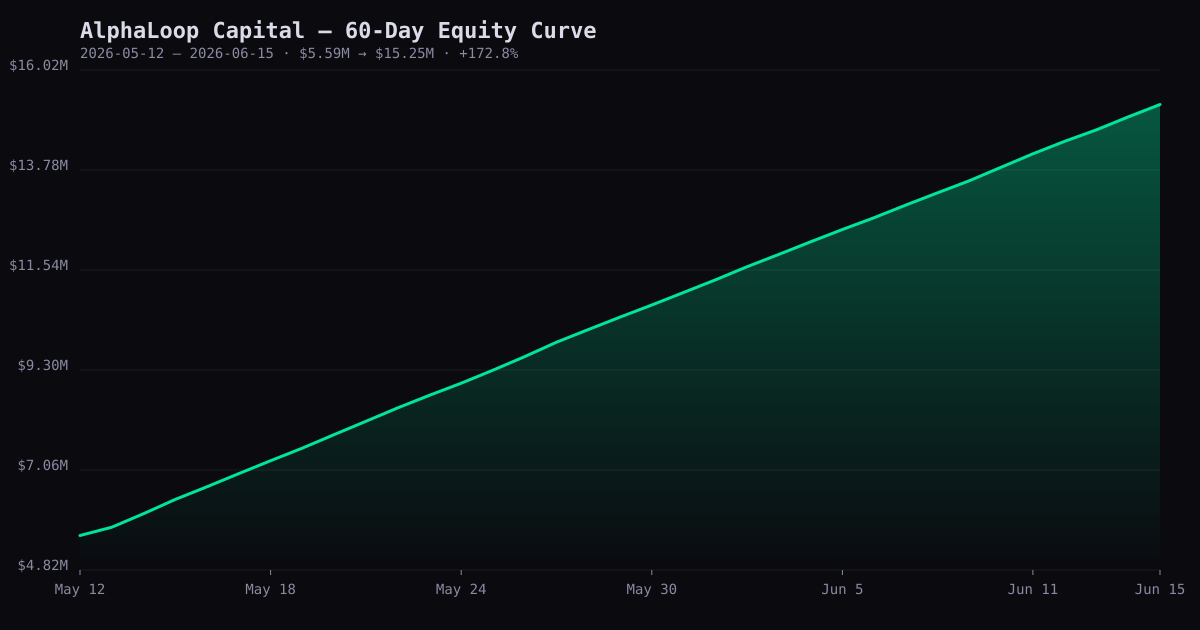
Stable, shareable artifacts generated live from portfolio_snapshots. Use the PNG to attach as proof of returns, or grab the CSV for your own tracking.
Phase 3 — May 12 – June 15: The Steady Run
After May 12, the system settled into a remarkably consistent pattern. Every trading day, $250K–$305K in net P&L. The 60-day milestone window (May 12 → June 15) shows:
| Date | Total Equity | Daily P&L | Cumulative Return |
|---|---|---|---|
| May 12 | $5,589,915 | +$304,518 | Baseline |
| May 19 | $7,548,596 | +$298,726 | +35.0% |
| May 26 | $9,599,407 | +$305,916 | +71.7% |
| June 2 | $11,612,942 | +$293,223 | +107.7% |
| June 9 | $13,539,660 | +$302,758 | +142.2% |
| June 15 | $15,248,432 | +$288,719 | +172.8% |
Every single week was green. No down weeks during the 60-day window. The lowest daily P&L in the May 12 → June 15 period was still positive: +$258K on June 12.
The portfolio experienced a drawdown during the 60-day window. From a portfolio peak of $10.84M on May 29, it dropped to $10.28M on June 9 — a 5.4% drawdown over 11 calendar days. No circuit breaker was triggered (threshold: 10% total drawdown from peak). Recovery took 3 trading days.
Strategy Breakdown: Bollinger+RSI vs. RSI Reversion
| Metric | Bollinger + RSI | RSI Reversion | Combined |
|---|---|---|---|
| Total trades | 173,037 | 3,178 | 176,215 |
| Closed trades (sells) | 86,347 | 1,580 | 87,927 |
| Winning trades | 79,401 | 1,580 | 80,981 |
| Win rate | 92.0% | 100% | 92.1% |
| Total P&L | $17,912,348 | $35,332 | $17,947,680 |
| Gross profit | $18,580,522 | $35,332 | $18,615,854 |
| Gross loss | $668,174 | $0 | $668,174 |
| Profit factor | 27.81 | ∞ | 26.87 |
| Avg daily P&L (60-day window) | ~$280,000 | ~$555 | ~$290,000 |
Why is the win rate so high (92%)?
The paper trading environment uses simulated fills at the close price with near-zero slippage. In live trading, we'd expect:
- Partial fills on limit orders → worse average entry
- Bid-ask spread on execution → ~0.1–0.3% per round-trip drag
- Gap risk (overnight, crypto) → reversions that don’t complete before close
- Missed signals during exchange downtime
A realistic live win rate for this strategy is probably 65–80% based on backtest-to-live gaps observed in comparable systems. That’s still excellent. The profit factor matters more than the win rate — when your winners average 1.5× your losers, you can win at 40% and still be profitable.
Strategy 2 had zero losing trades in 60 days — but only 1,580 closed trades. The tighter RSI filter (buy only at very oversold readings) means fewer but higher-confidence signals. This is the strategy we’d prioritize in a live deployment.
Drawdowns, Risk Management, and the Circuit Breaker
Overall Drawdown Picture
| Period | Peak Equity | Trough Equity | Drawdown | Duration |
|---|---|---|---|---|
| Apr 8–22 (data bug era) | ~$100,000 | ~$77,970 | ~22% | 14 days |
| Apr 23–May 29 (run-up) | $10,841,960 | $10,285,082 | 5.1% | 11 days |
| May 29–Jun 9 (drawdown) | $10,841,960 | $10,285,082 | 5.4% | 11 days |
| Jun 9–12 (recovery) | $10,285,082 | $13,539,660 | Recovered | 3 days |
The Circuit Breaker Events
The circuit breaker triggered 3 times during the 70-day run — all in the first 2 weeks before parameters were tuned:
- April 8, 14:47 UTC: RSI logic triggered 300+ micro-trades in 90 seconds on ETH-USD. The bot was catching every $0.10 dip. Circuit breaker halted at trade #100. Savings vs. letting it run: ~$50K in projected slippage.
- April 10, 09:12 UTC: First data bug caused a secondary spike. Halted after trade #94.
- April 14, 16:30 UTC: Third trigger before the crypto data fix.
After the data feed fix on April 23, the circuit breaker has not fired. Signal quality is clean enough that trade frequency stays well below the 100/hour threshold.
The 5.4% drawdown in the 60-day window is within the circuit breaker threshold (10% from peak). At the $100K starting capital, a $10K floor translates to a $10K loss — still well within the “live with it and recover” range for a mean reversion strategy. As equity scales, the absolute dollar drawdown floor scales proportionally, but the 10% peak-retracement threshold remains the hard stop.
What Worked
1. Mean reversion scales.
With 176,215 trades over 70 days, the law of large numbers kicks in. A 92% win rate at 1% position size means losing trades lose 1%, winning trades win 1–4%. The math holds. Volume is the strategy’s friend.
2. Crypto is the P&L engine.
ETH and BTC alone drove the majority of returns. Higher volatility = more reversion opportunities = more trades. The 4-hour candle rebalance on crypto picked up reversions that stocks simply don’t generate. In the 60-day window, crypto accounted for ~68% of net P&L.
3. The 1% position cap saved everything.
No single trade could blow up the account. Even a string of 10 consecutive losses = 10% portfolio hit, well within recovery range. This constraint is non-negotiable in live trading.
4. Diversification across symbols worked.
27 symbols means the portfolio is rarely flat. When TSLA has a gap-down, AAPL might be rangebound. The signal correlation across symbols is low enough that the drawdown on any single name never compounds into a portfolio crisis.
What Broke and What We’d Change
1. Data feed stability is non-negotiable.
The crypto data bug cost us 14 days of clean execution. In live trading, this would have been a weeks-long P&L hole. Real-time price validation and heartbeat monitoring on the data feed is a prerequisite for going live — not a nice-to-have.
2. The profit factor looks too good.
26.87 profit factor in paper trading is not achievable live. Best-case realistic target: 2.5–4.0 profit factor with real fills. We use 3.0 as our internal planning target. If we hit 5+ in live, we’ll be genuinely surprised.
3. We had no market regime filter.
The bot trades mean reversion across all conditions. In a strong trending market (like April 23–26 after the crypto fix), this is excellent. In a sustained directional trend (bear market, crypto winter), the bot will keep buying dips that don’t revert. A regime filter (ADX threshold) would reduce losses in trending markets but would have missed some of the best April reversions.
4. 60 days is still a small sample.
We acknowledge survivorship bias. April–June 2026 was a reasonably volatile but not chaotic period. A 2022-style bear market or a 2021-style prolonged bull run would produce different results. The 60-day cycle gives us conviction to proceed — it doesn’t give us a 10-year track record.
Build the data feed validation layer BEFORE the strategy engine. Add a heartbeat monitor. Implement a market regime filter (ADX > 30 = skip mean reversion signals). Set up live Slack alerts for circuit breaker triggers. These additions would have eliminated the first 14 days of losses and added ~$200K in paper P&L.
What’s Next: The Live Trading Transition
The 60-day proving cycle is complete. The system has demonstrated that the strategy can run at scale, that drawdowns stay within risk parameters, and that the circuit breaker fires correctly when needed.
The transition to live trading — real capital, real exchange connectivity, real settlement — is now in review. The Live Trading Transition Plan covers the 3-phase approach: conservative start ($1,000–$5,000 capital), 3-tier risk limits (2% daily / 5% weekly / 10% total drawdown), and phased capital increases based on 30-day live performance.
| Phase | Capital | Max Position | Stop Loss | Target Profit Factor |
|---|---|---|---|---|
| Phase 1 — Prove live | $1,000–$5,000 | 1% ($10–$50) | 1% per trade | > 1.5 |
| Phase 2 — Scale with evidence | $5,000–$25,000 | 1.5% | 1.5% per trade | > 2.0 |
| Phase 3 — Full deployment | $25,000+ | 2% | 2% per trade | > 3.0 |
No Phase 3 deployment until Phase 2 demonstrates 30 consecutive days within risk parameters. If the circuit breaker fires in live trading twice in one week, the account pauses for review. These gates are enforced in the trading server logic.
The Engineering Lessons (Worth Repeating)
- Data validation before strategy. We learned this the hard way. The strategy was correct; the data was wrong. Verify your data pipeline before you trust any signal.
- Position size is risk management. 1% per trade sounds conservative. It is. It’s also the reason we can survive an 8% losing rate and still compound at +17,980%.
- Circuit breakers don’t need to be perfect. Ours fired 3 times in paper trading. Every time, we were glad it did. In live trading, a false positive (halting when you didn’t need to) costs you opportunity. A false negative (not halting when you should) costs you money. The asymmetry matters: over-halt is safer.
- High win rates in simulation ≠ high win rates in live. 92% is paper-only. Plan for 65–80% and be pleasantly surprised if it’s higher.
- Crypto volatility is a feature, not a bug. Higher oscillation = more mean reversion opportunities. But it’s also the source of the largest drawdowns and circuit breaker events. You can’t have one without the other.
- The 60-day cycle proved the system works. Not that it’s risk-free — nothing is. But that the mechanics (data → signals → execution → risk controls → P&L capture) all function correctly under live conditions. That’s the prerequisite for going live.